
Flowcharts are defined as types of diagrams that present the flow of a work process in a systematic way.
Specifically, these diagrams visually illustrate the specific and delicate steps and aspects through which one process is executed.
Flowcharts have a symbolic diagrammatic structure that helps for a clear and concise illustration of the steps of a workflow as boxes that are diverse in shape.
Namely, each box has a distinctive shape, which interprets different functions. The boxes that define the specific steps are connected between themselves with lines with guiding arrows that point to every step of the process from start to end.
A flowchart is a practical tool, which for the first time was introduced by Frank and Lillian Gilbreth in 1921.
The Gilbreths used a flowchart to describe a working process in the presentation titled ‘Process Charts: First Steps in Finding the One Best Way to do Work’, which was presented to the American Society of Mechanical Engineers (ASME).
Flowcharts are very useful for presenting the workload of a process as an all-encompassing guide. When creating a flowchart is important to carefully outline every step of the specific process, even the smallest details, by the use of lines, symbols, and text.
This thorough portrayal of the processes makes it easier to recognize if there are potential obstacles that might jeopardize the work process.
Particularly, identifying possible issues within the process makes it easier to achieve final objectives.
Benefitting from Flowcharts
Flowcharts diagrams can be easily created and understood. More importantly, through the step-by-step presentation of processes, they can improve the flow of an entire business operation. But these are not the ‘only’ things for which flowcharts are beneficial.
So which are the additional advantages that flowcharts offer?
Improved communication and coordination
Flowcharts are known for improving communication as they describe business processes in detail. What does this mean? It means that every time a change in the process is made, everyone can see it in real time and discuss how it affects the whole operation.
Effective analysis
With the creation of flowcharts, a greater analysis of the business processes is possible. This analysis is doable because the flowcharts specifically show what steps are required for the realization of a particular project. Additionally, since every shape is designed to describe a certain part of the process, the flowchart has the role of an instructive guide, which facilitates the process of analysis.
Problem-solving
Every flowchart, regardless of the type, can be very effective in finding a solution to a problem in a work process. As flowcharts, in reality, illustrate the workflow of a business process in detail, they can be used as a problem-solving technique. In other words, when one work process is broke down into the smallest steps, the chance to leave out an important component is minimal. This makes the possibility to find a solution to a problem greater.
Wide Variety of Flowcharts
Flowcharts are diagrams, which are characterized by versatility and flexibility. It means that the information in the flowcharts is possible to be organized and presented in different structures. Consequently, there is a variety of flowcharts that can be used for numerous processes’ representations. Overall, the most used flowcharts are the following:
Basic Flowchart
A simple Flowchart is extensively used for describing the process of planning a new project. This simple type of flowchart is a great technique for presenting the specific steps of a new project that are based on decision-making.
Process Map
A Process Map is a flowchart used with the purpose of auditing a process for malfunctions. This flowchart can help in making process improvements by analyzing every small step in depth. A process map is a practical and useful flowchart that can indicate opportunities for process and business improvement.
EPC Diagram
The EPC (event-driven process chain) Diagram is a specific flowchart designed for modeling different business processes that include set of simple or complex tasks. There are symbols and characters available for these flowcharts that can’t be used for traditional flowcharts.
Swimlane Flowchart
The Swimlane Flowchart is an ideal choice for presenting process documentation. This flowchart can be practical for presenting more complex process documentations that involve both external and internal requirements, such as process improvement, employees’ flexibility, quality of performance, etc. Swimlane flowchart also defines who does what in a process.
Data Flow Diagram
The ideal tool for presenting the process of flowing information through an information system is the Data Flow Diagram. Apart from the flow, the data flow diagram also specifies what kind of information is run through a particular system.
Practical Uses of Flowcharts
Different types of flowcharts are used for different purposes, such as presenting a plan for a new project, illustrating a business process or analysing a process. When it comes to the industries and disciplines where flowcharts find their use the pool is deep.
A flowchart can be implemented as a practical business technique in many industries, including education, science, engineering, manufacturing, architecture, government, and more.
Creating Flowcharts with iMindQ
iMindQ® is a useful mind mapping tool that offers the possibility of creating the basic type of flowchart which is used for planning a project. In order to attain a clear and concise display, iMindQ flowcharts can be composed to show the flow of a process in two directions: from left to right or from top to bottom.
With iMindQ®, the creation of flowcharts is very easy as it allows users to arrange the steps of a work process by themselves. There is a general flowchart template, which can be used; however, there is an entire library of flowchart shapes and symbols available to choose from. This is an advantage since not every process requires exactly the same symbols, so the user, according to his needs, can choose which are the most suitable for the particular process he is elaborating.
1. Specifying Initial Steps
In the process of creating a flowchart, is crucial to follow a few steps in order to create an excellent flowchart, which will explain the planned process’ actions clearly and adequately. The steps are the following:
- Define the flowchart’s purpose;
- Determine the necessary steps;
- Choose which shapes are most suitable;
- Add shapes with a label and make the relevant connections.
2. Choosing Flowchart Shapes
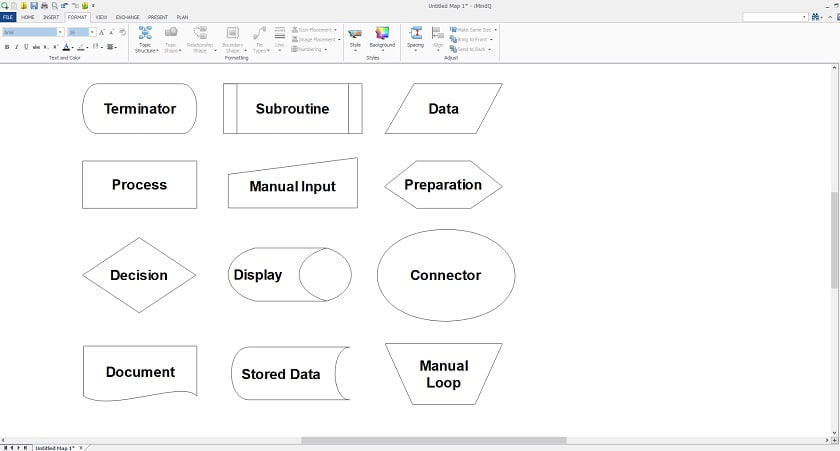
Terminator: Indicates the beginning or end of a program flow in the diagram.
Process: Indicates any processing function.
Decision: Indicates a decision point between two or more paths.
Document: Indicates data that can be read by people, such as printed output.
Subroutine: Indicates a predefined process.
Manual input: Indicates any operation that is performed manually.
Display: Indicates data that is displayed for people to read.
Stored data: Indicates any type of stored data.
Data: Presents any type of data in a flowchart.
Preparation: Indicates a modification to a process.
Connector: Presents an inspection point.
Manual loop: Indicates a sequence of commands that are repetitive until stopped manually.
3. Guide for making a Basic Flowchart
Open your iMindQ application;
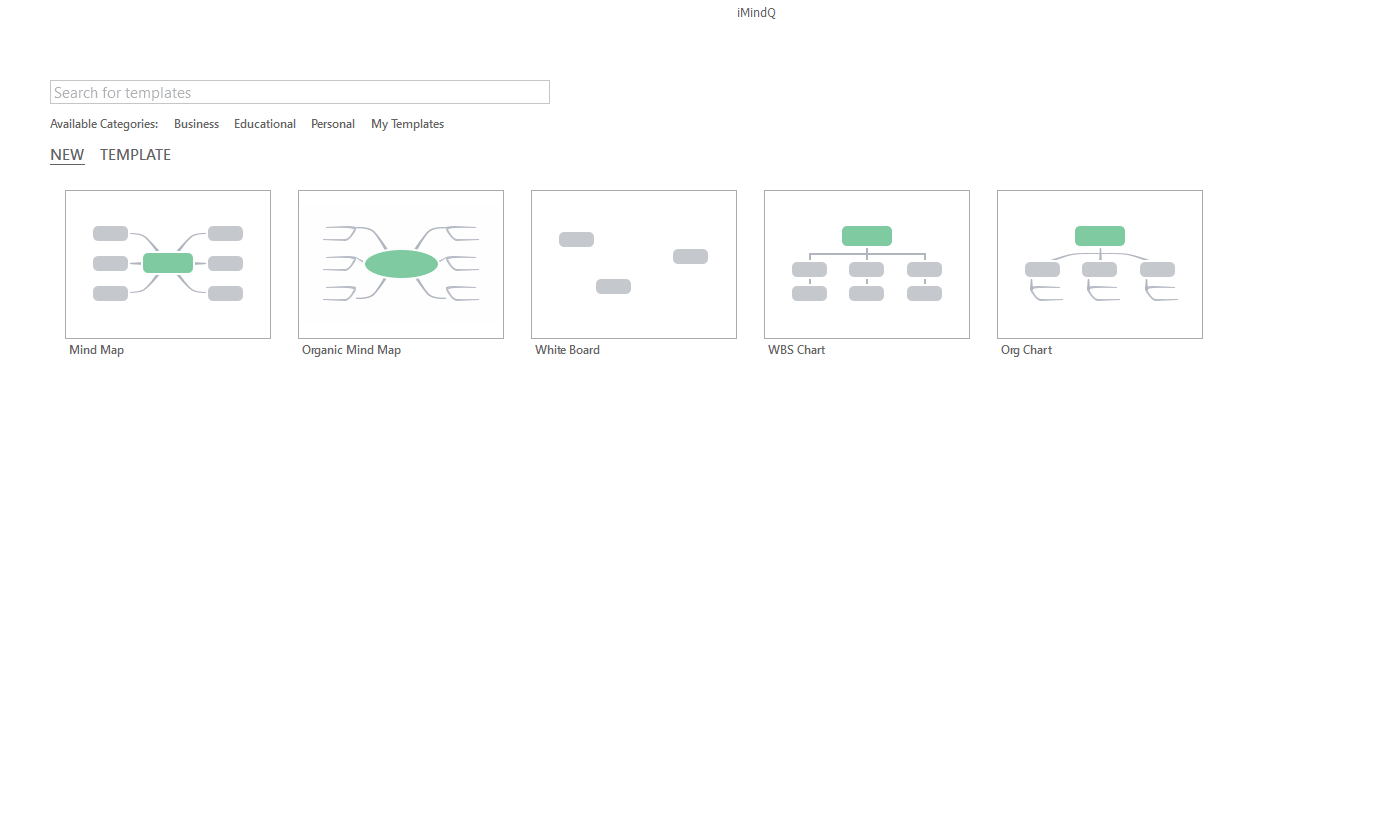
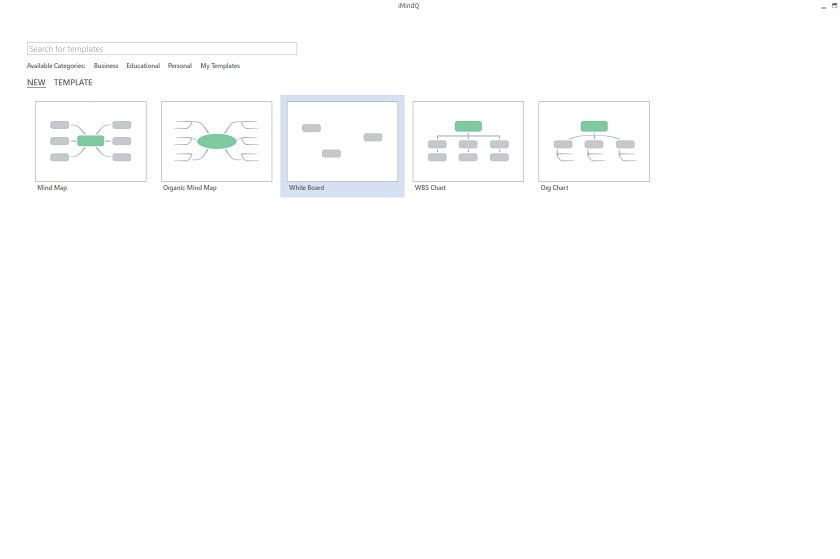
From New, choose the White Board template. This is our choice since it allows creating your Basic Flowchart according to your needs from scratch.
From Format go to Styles and choose Background > Pattern.
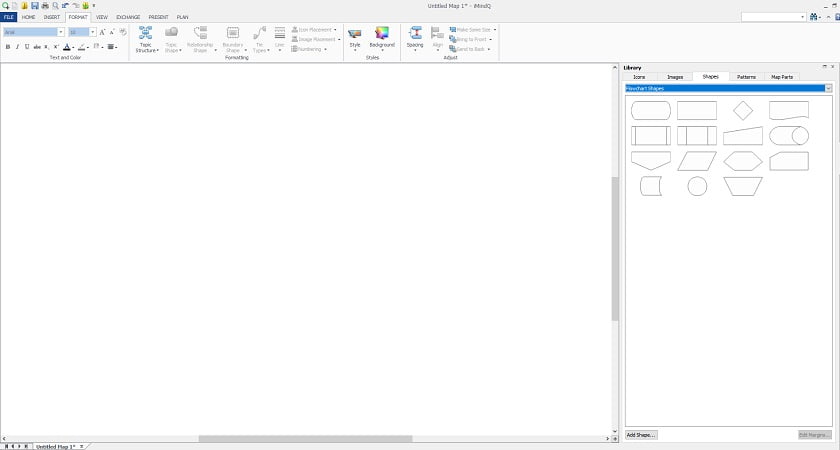
In this section called Library, you can find all the available Icons, Images, Shapes, Patterns, and Map Parts.

For the Basic Flowchart in the Library you will need to choose the section for Shapes;
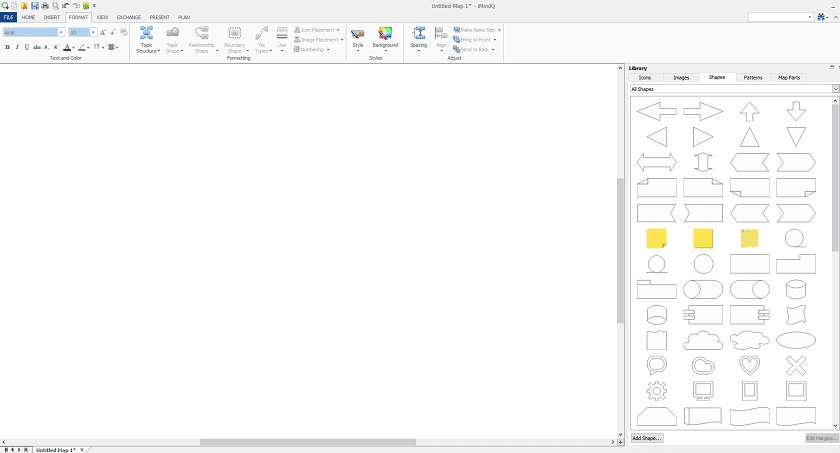
Now you can see that there are available many different shapes. However, for the Basic Flowchart In the search box, you will need to select Flowchart Shapes.
There are available 15 types of flowchart shapes, which have diverse uses and meanings.
If you are not familiar with what exactly means each shape, check the part for the Definition of flowchart shapes in this article.
Next, you will need to select one of the shapes and insert it by double clicking on it.
After, you can add the desired label or text inside the box simply by start typing while the shape is selected.
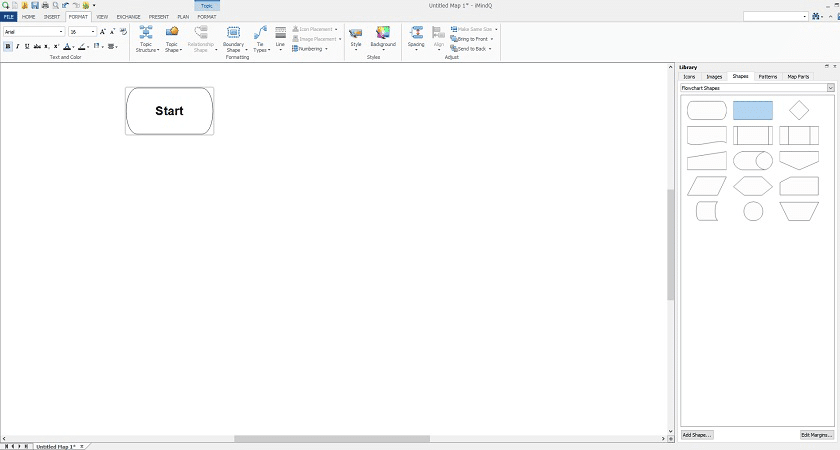
The first box is added to your Basic Flowchart.
For adding another shape, again, select it and double click on it.
After, finishing this step put a label in the box;
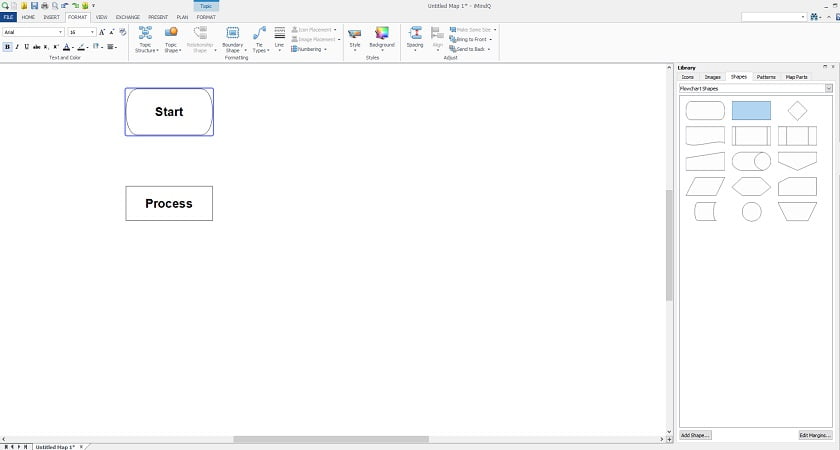
Now you have two boxes, which need to be connected.
To go to the next step, i.e. to Add a Relationship, you will need to select one of the boxes by Right clicking on it > Insert > Relationship.
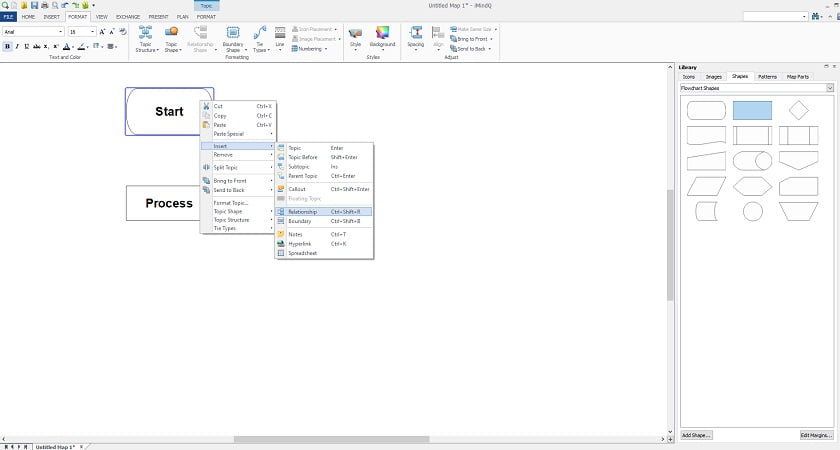
After clicking on Relationship, you will notice a red sign while moving with your mouse.
This means that you need to decide in which direction to pull the arrow.
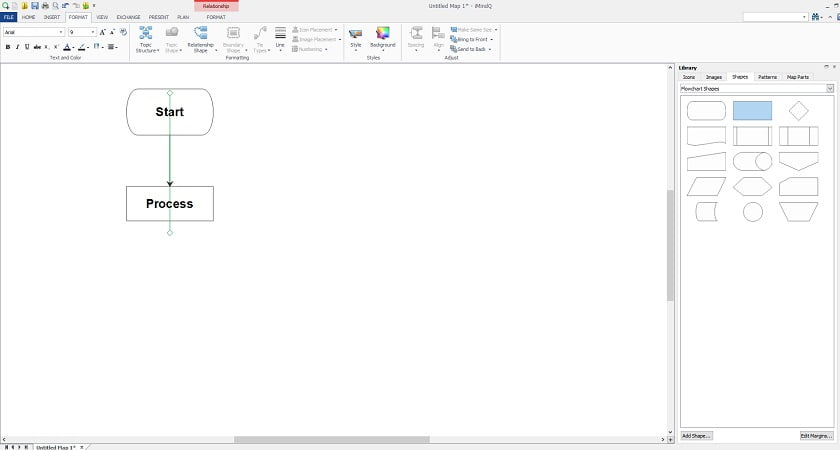
Since for now, you have two boxes, you will need to select the topic from which you previously added a relationship, in this case
Start, and then pull the green line towards the other shape, in this case, Process.
![]()
After pulling the line towards the other box and clicking on it, you will get to the picture below.
Now you have two boxes for which you created a ‘from top to bottom’ relationship.
Continue adding boxes and relationships according to your needs.
When you are finished with composing your Basic Flowchart, click on File > Save As and save your Flowchart.
About the author

Kristina Gjorgievska, a content writer and translator. Eternal inspiration: magical Italy, Jim Morrison’s poetry, Bernardo Bertolucci’s timeless “Stealing Beauty”, the dynamic and meditative Ashtanga Yoga. You can connect with Kristina on LinkedIn.