FISHBONE ANALYSIS DIAGRAM
MIND MAP
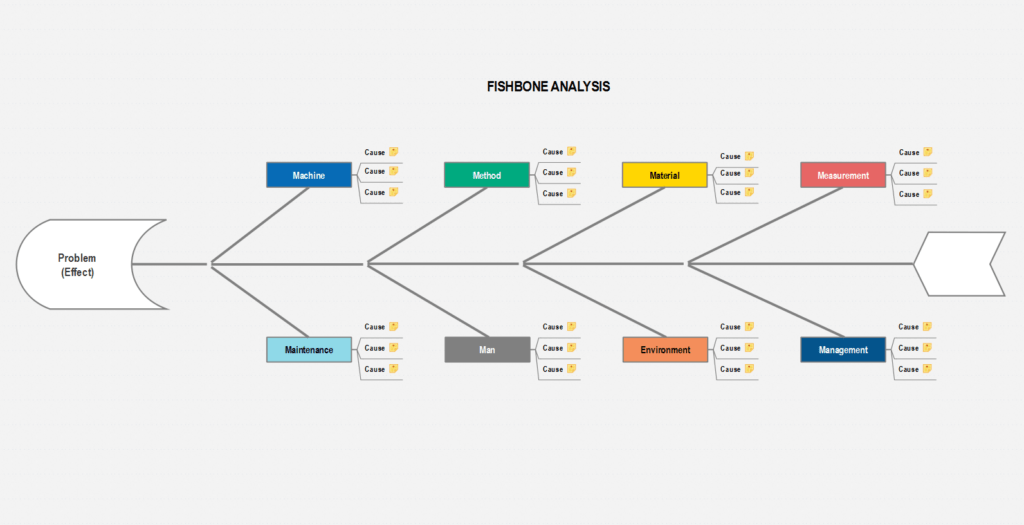
The Fishbone Analysis diagram is used for identifying and visualizing the main causes leading to a particular problem or effect.
When making a Fishbone Analysis diagram firstly you need to define the problem or effect, which needs to be examined. After determining it, you can proceed with visualizing the main causes.
The ready-to-use template of a Fishbone Analysis Diagram created with iMindQ, for example, includes eight causes that contribute to a specific problem.
The template is editable and adaptable, so you can download and modify it by your preference. You can change the number of identified causes, which need to be at least four. In the end, start decomposing each cause into sub-causes until the root causes are determined.