Ask a project manager what’s going on with their project and they will probably pull up a Gantt chart to show you.
A Gantt chart (named after Henry Gantt who introduced the idea) is made up of horizontal bars visually representing task durations. The longer the task, the longer the bar. The dates are at the top so you can quickly see when work is due to happen.
There is nothing inherently wrong with Gantt charts. They are well-used and loved by many, they show the big picture for a project and they are visual so they work well for people at all levels.
But the more you put on the Gantt chart, the messier it looks. By the time you’ve added the names of the people doing the work, the linkages to other tasks, a scattering of milestones, progress bars showing how much of a task has already been completed, etc. It can be difficult to interpret what you are actually seeing. And we all know how managers like communication tools to be simple.
So what can you use as a Gantt chart alternative? There are plenty of creative Gantt charts alternatives for displaying timelines. Here are 3 alternatives to Gantt chart that will work for everyone on the team.
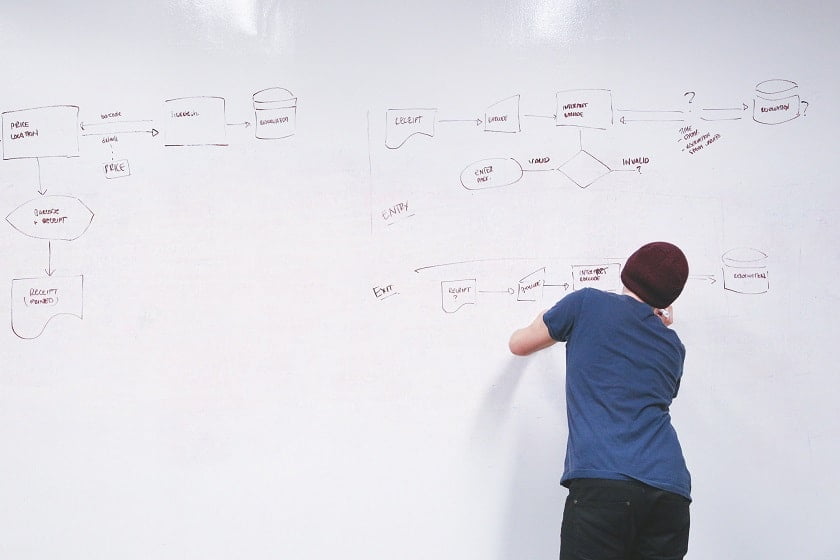
Flow Diagrams
You don’t need a complicated scheduling tool if you have a relatively straightforward piece of work that can be represented with a flow diagram.
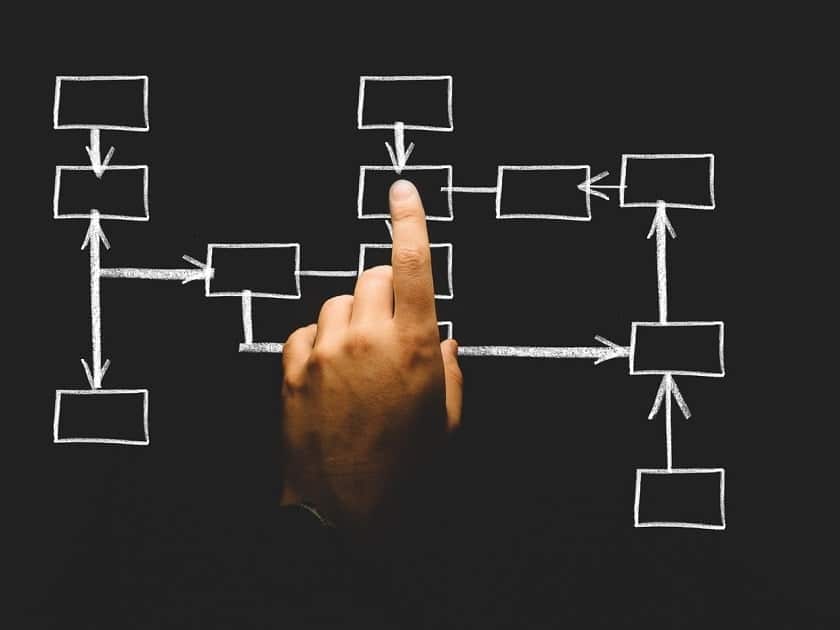
You can also take this a step further and plot out network diagrams. These are like flow diagrams but they include a little more information. Each project task has a box to itself and the lines linking the boxes illustrate the order of tasks. By including start and end dates for the task you can work out the overall project duration. You can add whatever else you want, such as resource names or a task ID number, but the more you add in the busier your document will look.
Flow diagrams and network diagrams are best for simple projects and you’ll have to find a way to add a visual representation of the time taken (for example, chunking up the diagram so the months are grouped together somehow). This could help because at first glance it can be quite difficult to see what should happen when.
Mind-Mapping
A mind mapping tool could be an effective Gantt alternative. Use a tool like iMindQ to plan out all the work for a project. The mind map will help you see what work needs to be done and you can also use it more formally for creating a work breakdown structure.
A work breakdown structure details out all the work that needs to be done and groups those activities thematically. It can help you organize your project into manageable sections which then become delivery phases. It can also help you see at a glance whether there is more or less effort required in certain areas because your common sense will tell you.
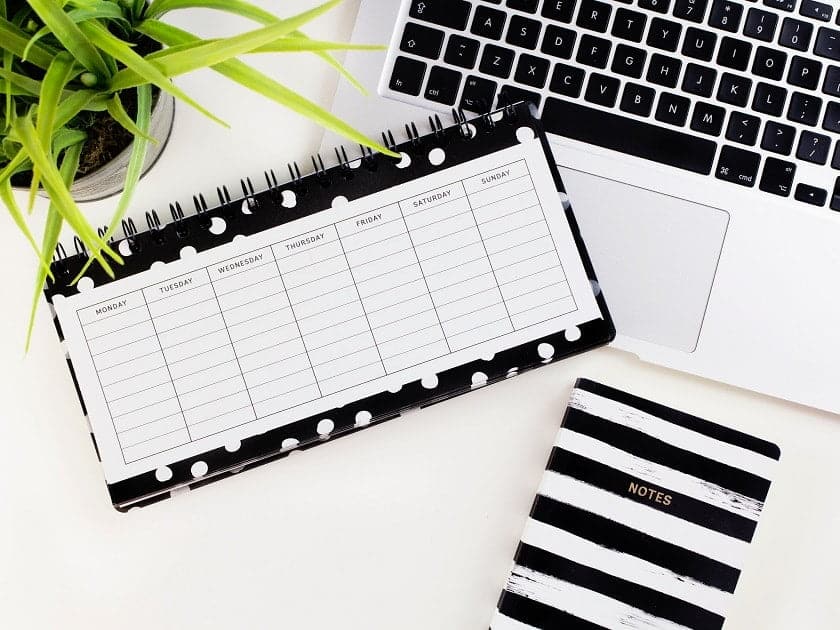
Task Lists
Task lists are a common ‘go to’ tool even if you do use Gantt charts. In fact, the left-hand column of a Gantt chart could act as a big To-Do list.
However, a task list without all the pictorial bars and lines is a lot easier to understand for many people. Not everyone takes in information visually and those of us who prefer lists will certainly benefit from the clarity which a good To-Do list brings.
There are lots of ways to manage your tasks in list format. Use your mind-mapping software creatively to add the task in the form of a list. Pick your favorite app. Type them up in a spreadsheet or Google Docs. Use sticky notes. Stay old school and manage with a notebook and pen.
Ticking off the tasks is immensely satisfying, instantly clear, and takes no explaining to your management team. They probably use lists themselves so they’ll be able to understand your progress quickly.
You can add extra columns to your task list to cover the forecasted end date, priority, the name of the person doing the work, and more, but it could become quite cumbersome. Try to keep it concise and only include the information that is vital for you to manage the work.
Task lists are perfect for small and medium-sized projects. You’ll probably find that anything larger does require a Gantt chart just because it’s easier to keep that up to date with changing requirements, and you can see the impact on later tasks if you have to move an earlier one around. However, if your project is small, you can’t beat a task list.
Are you reliant on Gantt charts? What alternatives do you find work best for your executive stakeholders? We’d love to hear your thoughts in the comments section below!
About the author
 Elizabeth Harrin is the author and award-winning blogger behind A Girl’s Guide To Project Management. Review her other predictions for hot business trends on her blog.